BI
Financial Performance Dashboard — Power BI
Replaced manual Excel reports with executive-ready KPIs and MoM analysis
Bonus Photos / Details
The Problem
The company monthly extracted a financial report in CSV from the ERP with metrics like gross revenue, gross profit, net profit, COGS, and operating expenses. However, the data was raw, without organization, comparative calculations, or indicators to facilitate decision-making. The process was completely manual, unstandardized, and consumed significant management time.
The Solution
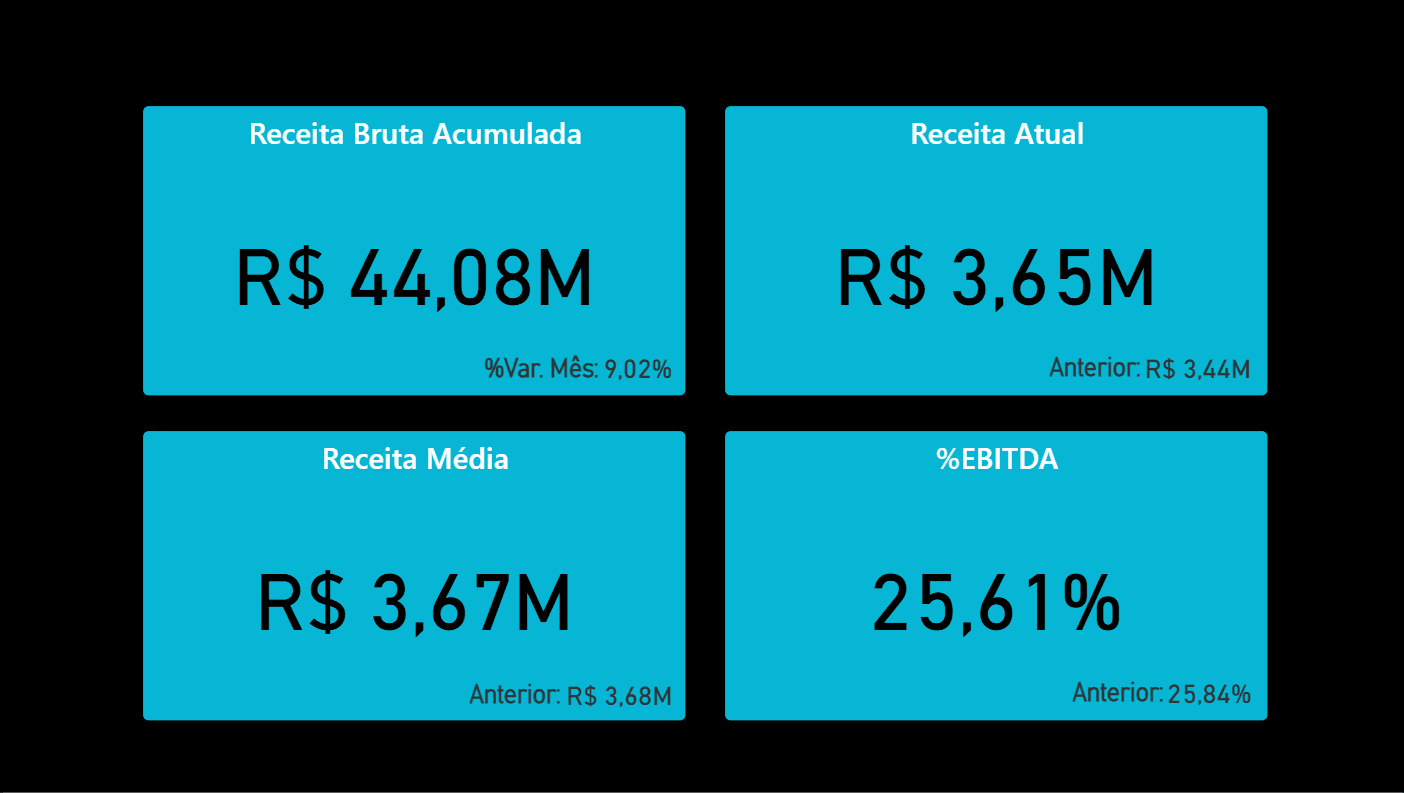
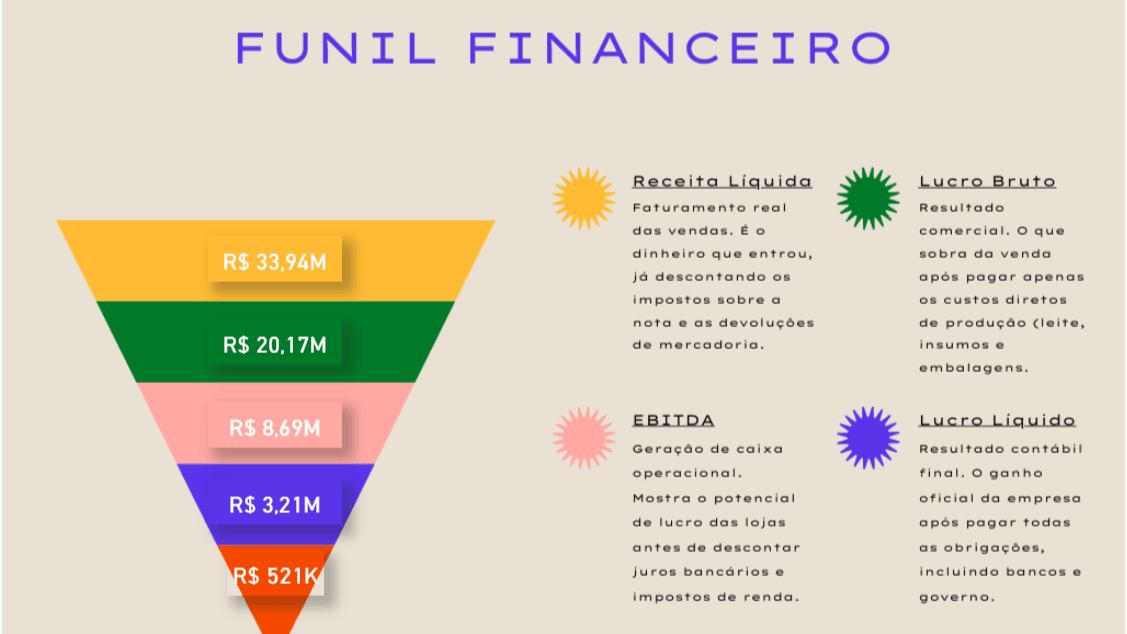
I developed a strategic financial dashboard in Power BI that transforms raw data into actionable information. The solution includes automated metrics, period-over-period comparisons (MoM), strategic visualizations focused on performance, and an intuitive interface designed for recurring use. I used dynamic parameters for metric control, line charts with dynamic indicator selection, and a structured financial funnel for strategic reading.
Tech Stack
Impact Generated
- Significant reduction in monthly financial analysis time
- Faster and clearer decisions based on processed data
- Complete standardization of monthly analysis
- Total replacement of manual raw Excel
- Dashboard actively used by the board
Time Reduction
1h 30m
Analysis Speed
Drastic reduction
Status
Actively used by the board
Tech Stack
Overview
BI
Technical Stack
Technical Challenges
- Creation of fully dynamic table controlled by user
- Building multi-stage financial funnel
- Modeling to enable period-over-period comparisons
- Automated calculation of metrics like EBITDA and margins